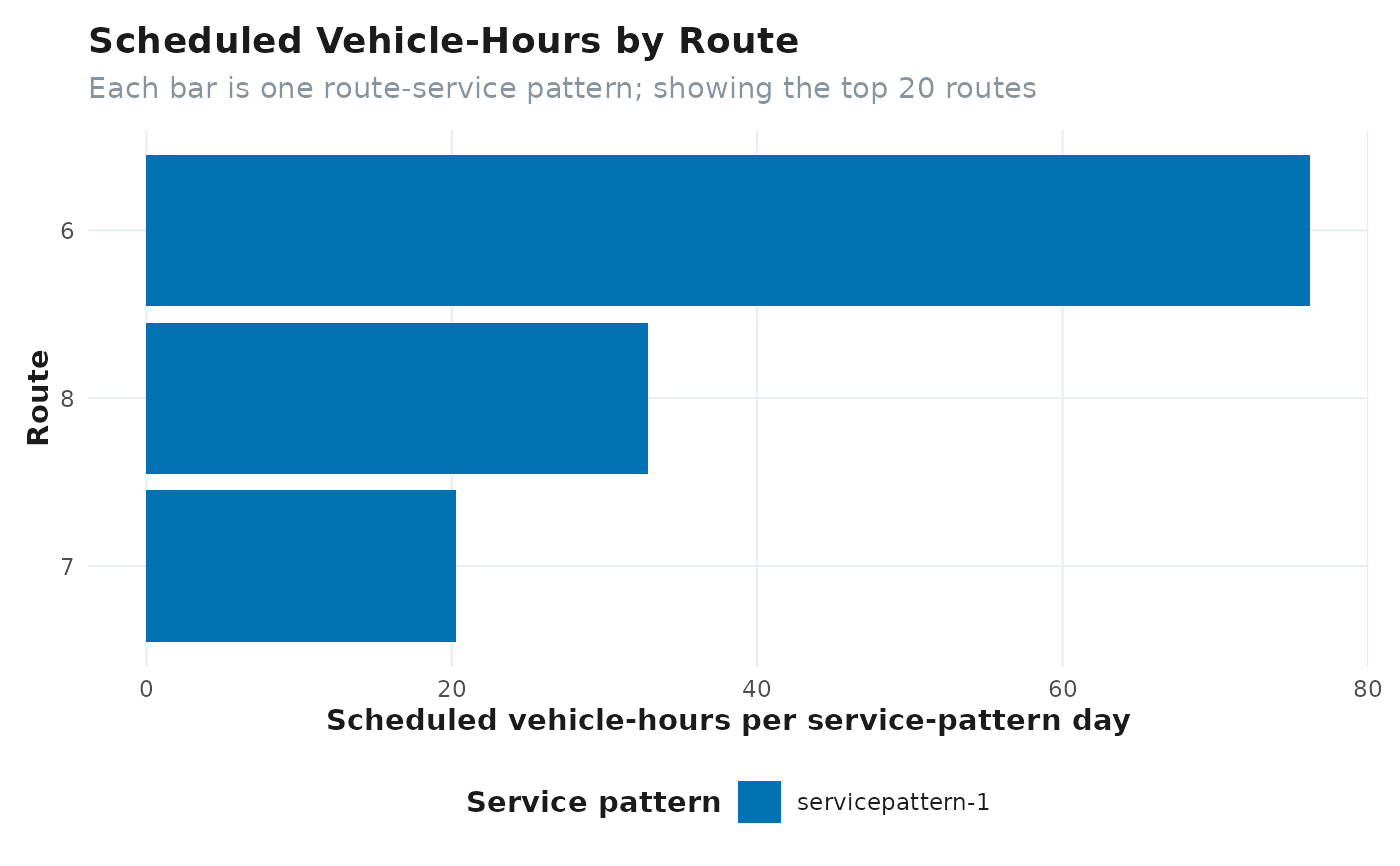
Sums scheduled end-to-end trip durations for each route and service
pattern.
Usage
plot_servicesupply(gtfs, top_n = 20L)
Arguments
- gtfs
A GTFS object.
- top_n
Maximum number of routes to display.
Value
A `ggplot` object. Each bar is scheduled vehicle-hours for one
route on one representative service-pattern day.
References
[FTA National Transit Database](https://www.transit.dot.gov/ntd)
Examples
plot_servicesupply(for_rail_gtfs)