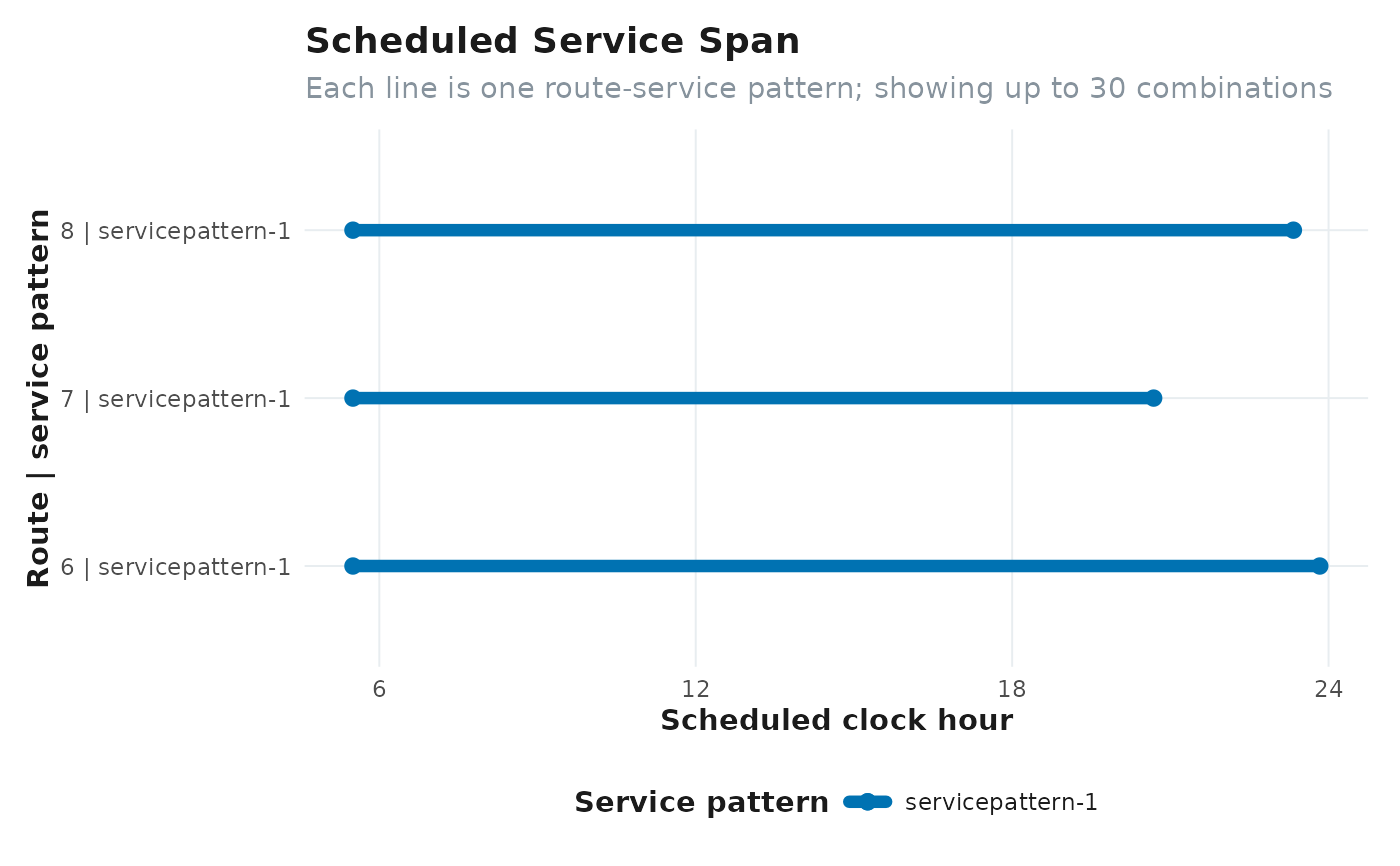
Shows the first departure and final arrival for route and service-pattern combinations. The longest and most frequently operated route-pattern combinations are retained when the feed is large.
Value
A `ggplot` object. Each horizontal line is one route and service pattern; its endpoints are scheduled clock hours.