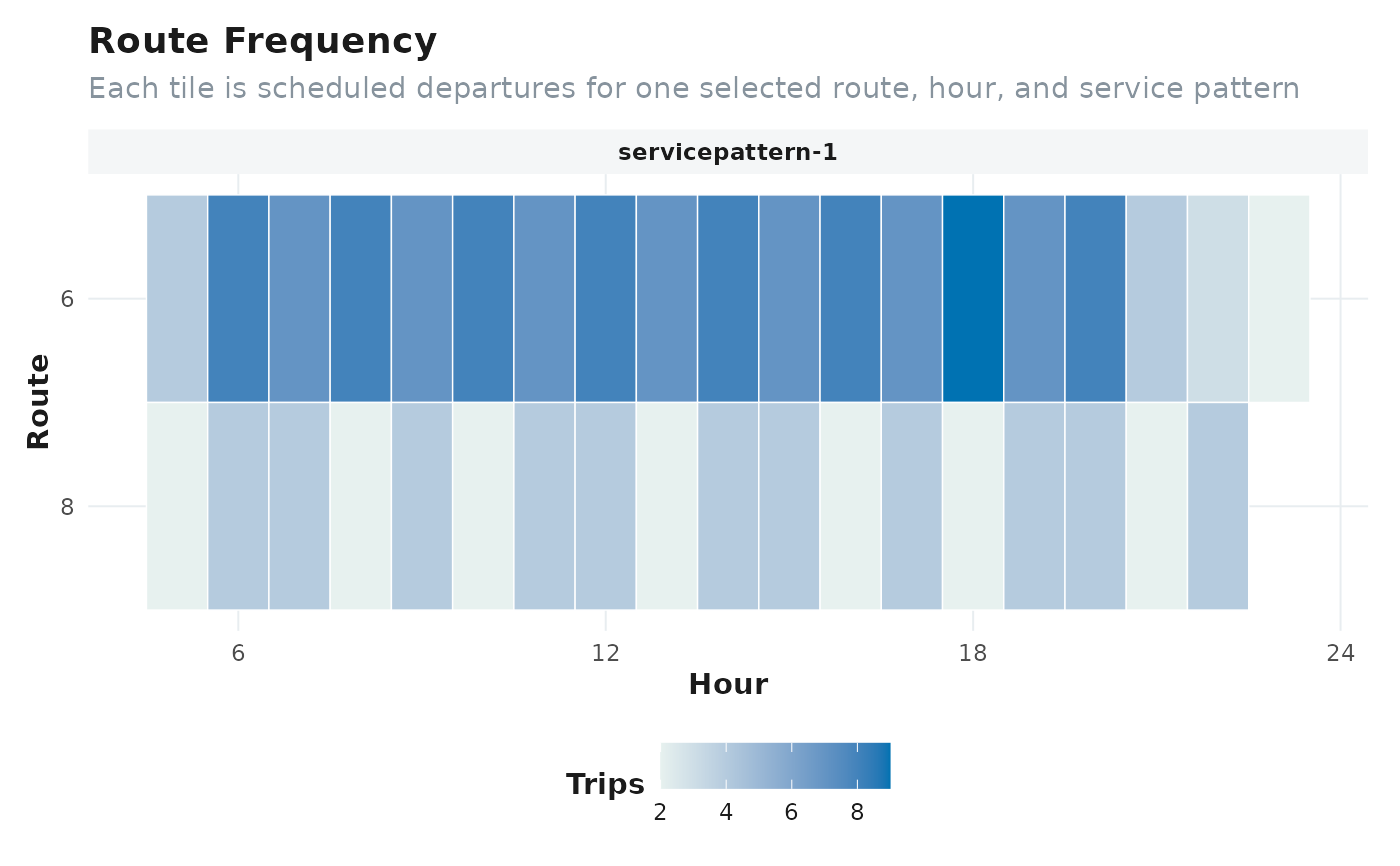
Creates a heatmap of scheduled departures by route, hour, and service
pattern. The tile fill is the number of scheduled trips.
Usage
plot_routefrequency(gtfs, route = NULL, top_n = 25L)
Arguments
- gtfs
A GTFS object.
- route
Optional character vector of route IDs. `NULL` includes all
routes after applying `top_n`.
- top_n
Maximum number of routes to display when `route` is `NULL`.
See also
[GTFSwizard::get_frequency()]
Examples
plot_routefrequency(
  for_rail_gtfs,
  route = for_rail_gtfs$routes$route_id[1:2]
)