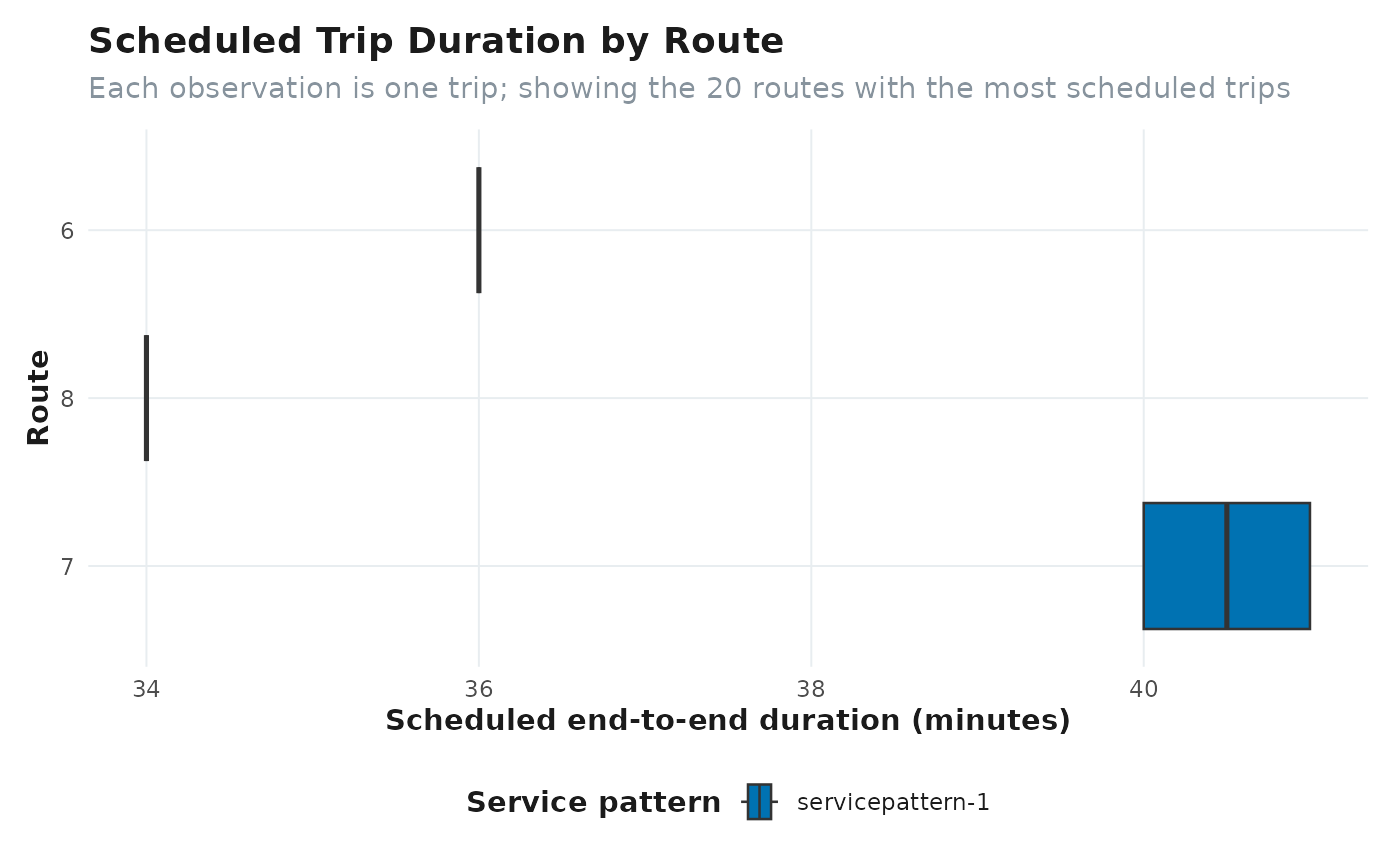
Shows the distribution of scheduled end-to-end trip duration for the busiest routes.
Value
A `ggplot` object. Each observation is one scheduled trip; boxes summarize duration in minutes by route.
Shows the distribution of scheduled end-to-end trip duration for the busiest routes.
A `ggplot` object. Each observation is one scheduled trip; boxes summarize duration in minutes by route.