Usage
plot_hubs(gtfs, i = 0.05)
Arguments
- gtfs
A GTFS object.
- i
Proportion of stops with the most routes to retain.
Details
To keep dense networks readable, at most 40 of the highest-ranked
stops are drawn. Ranking uses distinct route count and then trip count.
Examples
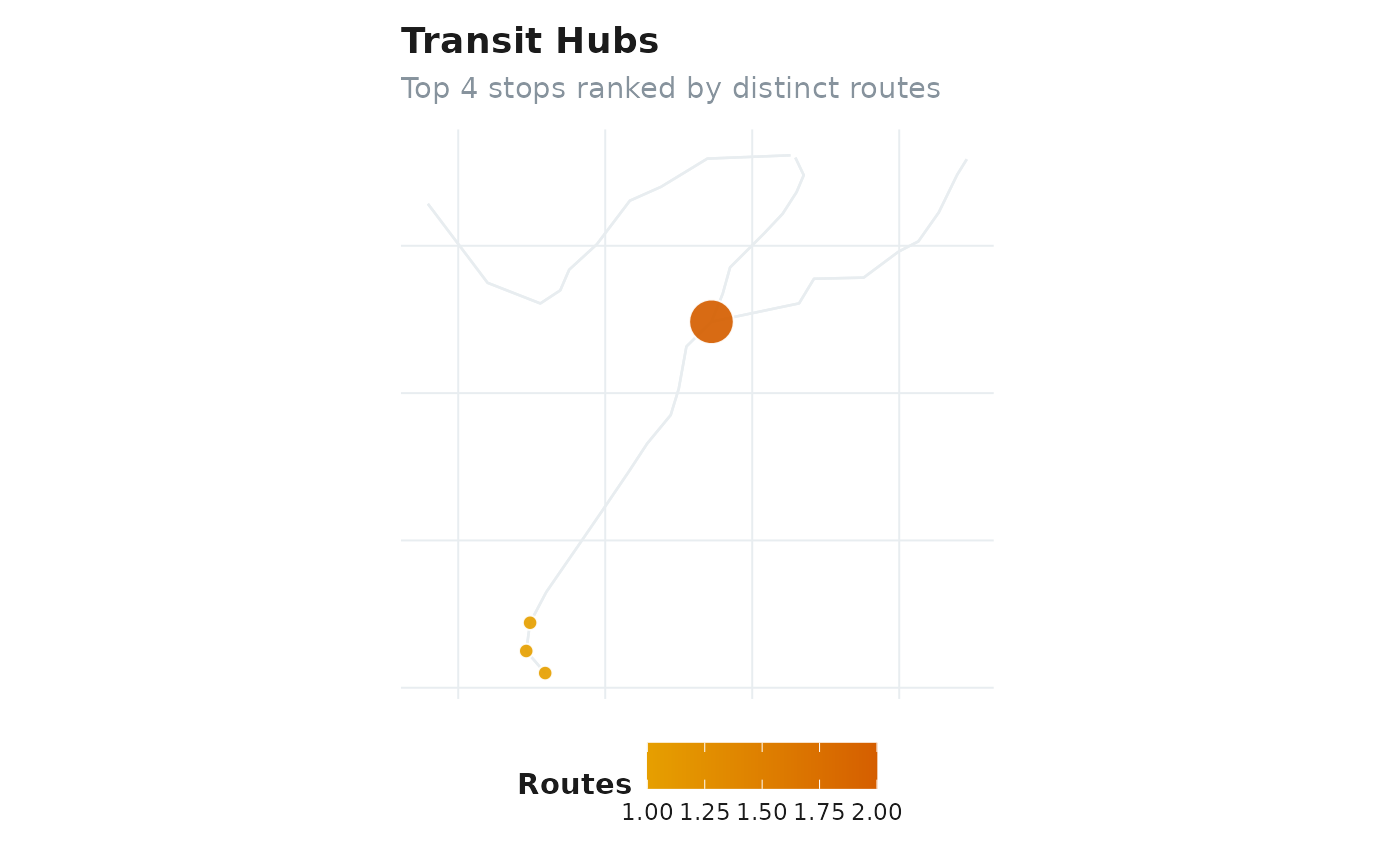
plot_hubs(for_rail_gtfs, i = 0.1)