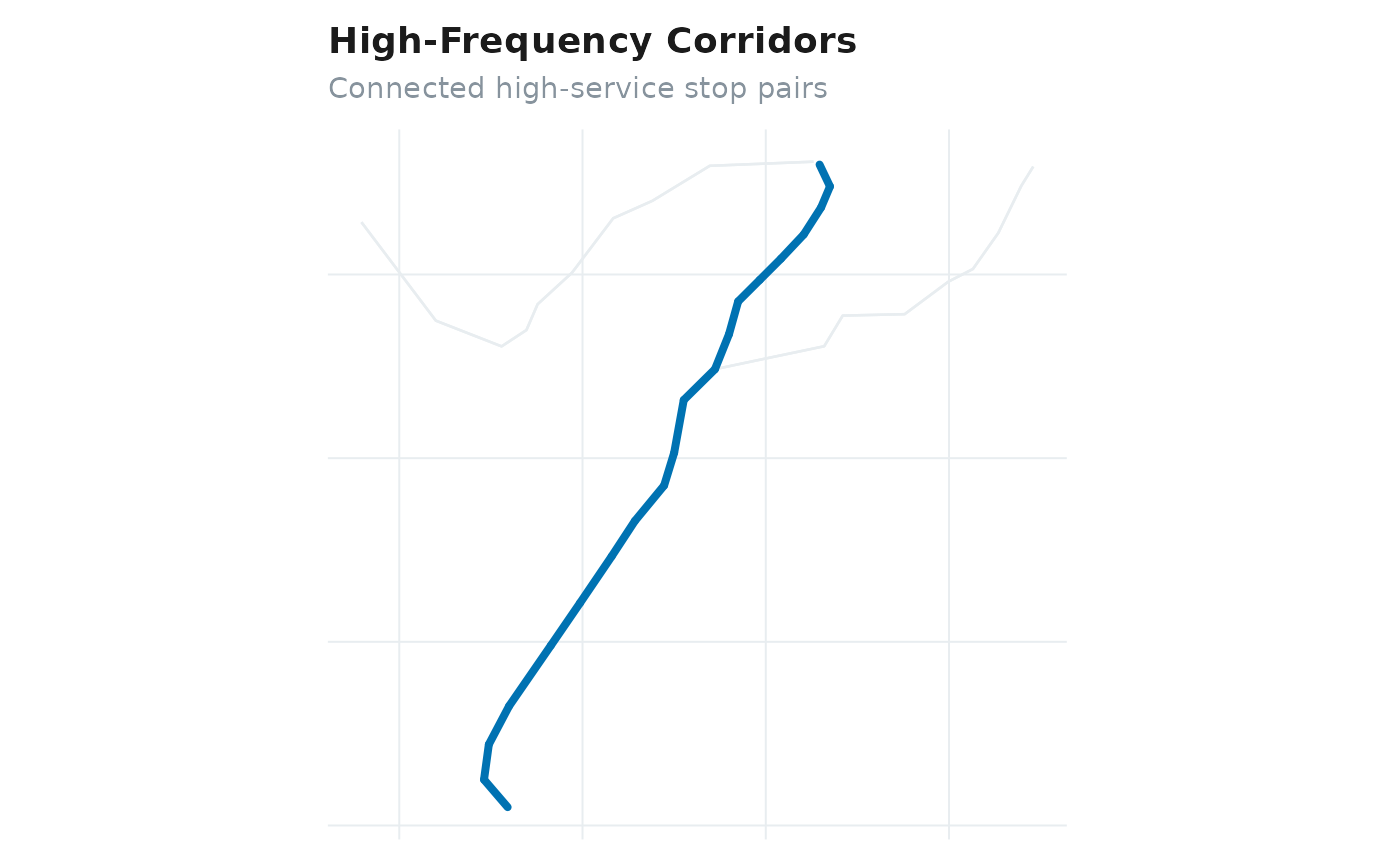
Plot High-Frequency Corridors
Usage
plot_corridor(gtfs, i = 0.01, min_length = 1500, ...)
Arguments
- gtfs
A GTFS object.
- i
Proportion of highest-frequency segments to retain.
- min_length
Minimum corridor length in meters.
- ...
Supports the legacy argument `min.length`.
See also
[GTFSwizard::get_corridor()]
Examples
plot_corridor(for_rail_gtfs, i = 0.2, min_length = 100)