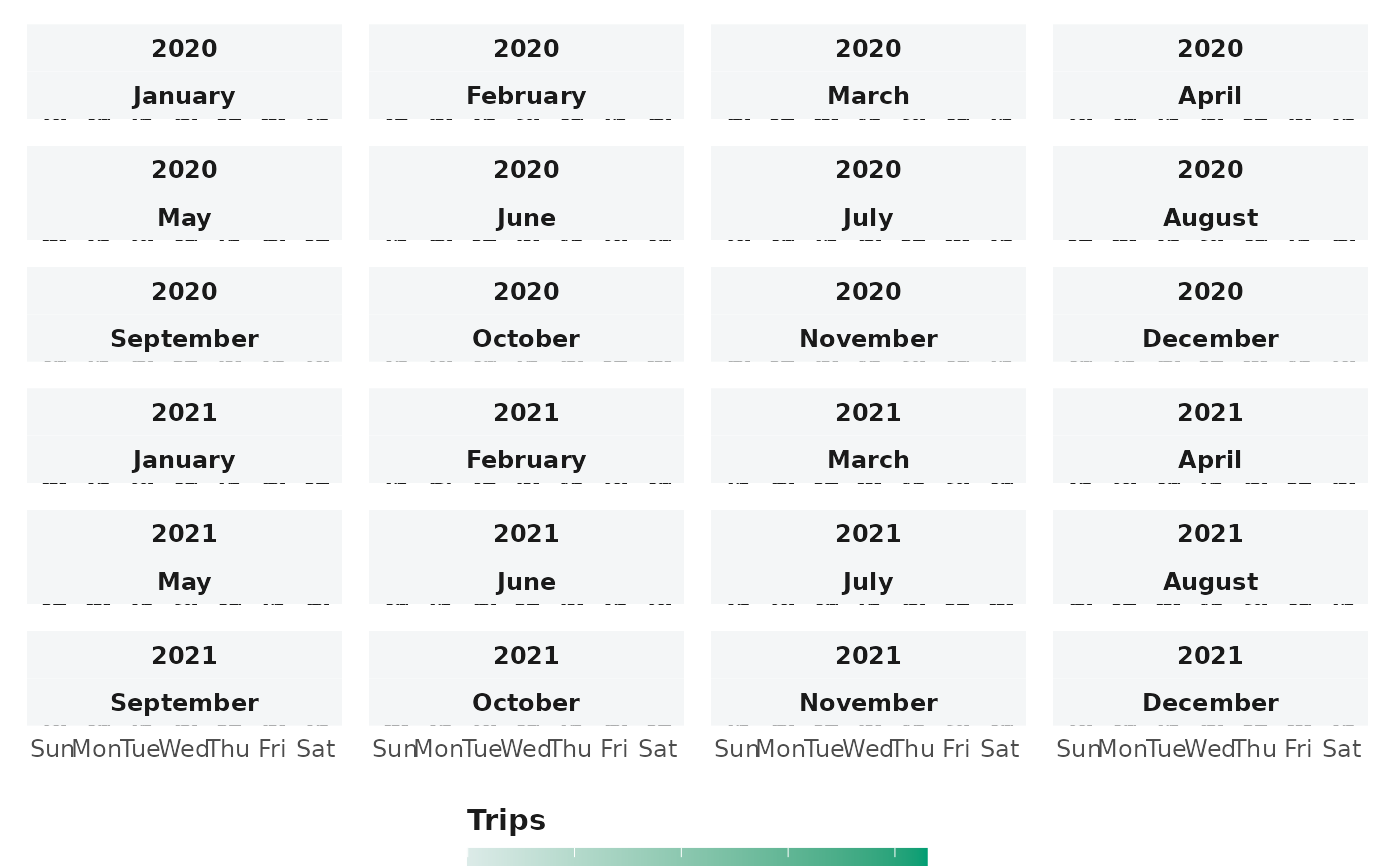
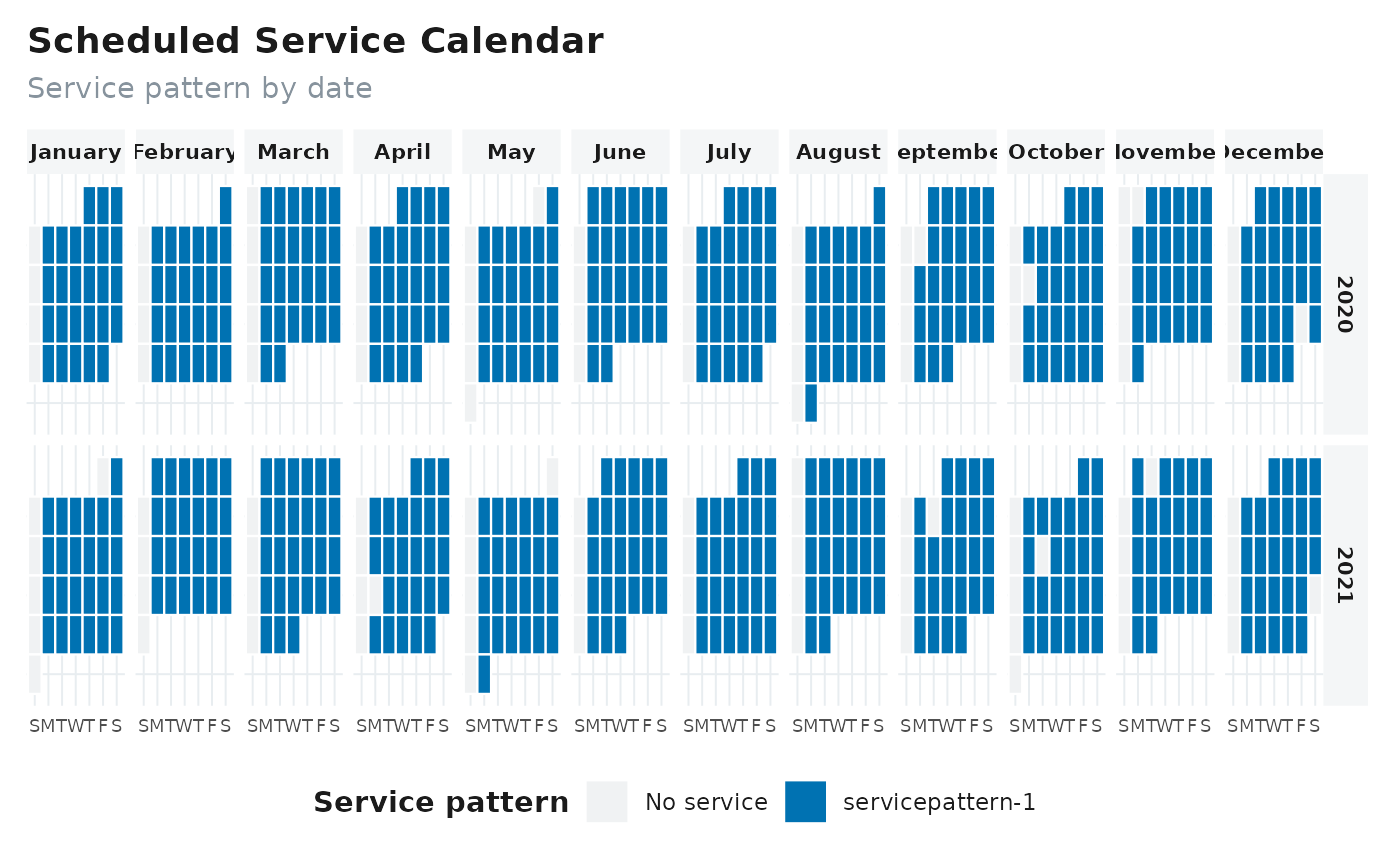
Creates a calendar heatmap of scheduled trips by service date.
Usage
plot_calendar(
  gtfs,
  ncol = 4,
  facet_by_year = FALSE,
  fill = c("trips", "service_pattern")
)
Arguments
- gtfs
A GTFS object.
- ncol
Number of facet columns when `facet_by_year = FALSE`.
- facet_by_year
Logical. Arrange years in rows and months in columns.
- fill
Calendar fill. `"trips"` shows trip counts and draws dates with no active service as zero trips; `"service_pattern"` uses a discrete color for each service pattern and labels dates with no active service as `"No service"`.